Skip to content

SapiensQ · Decision-maker simulation

We don't forecast rates.We simulate the committee that decides them.

Built for teams that track policy shifts and need an early, structured view.

The FOMC Simulation Platform dashboard: the next decision with days remaining and the target range in force, the forecast distribution, the scheduled releases before the decision, and the track record.

The dashboard is organized around three questions.

  • The next decision

    Days remaining, the current target range, and the starting policy stance, shown before the forecast itself.

  • What could change it

    Every scheduled release between today and the meeting, shown alongside the current outlook.

  • The record

    Matched outcomes, forecast error, and lead time relative to the market. Scored only after each decision is released.

The workspace

Each screen has a distinct role.

The published forecast is the platform's current call. The Market Record evaluates it only after the decision. Scenario Lab runs private experiments without changing either.

The Forecast & Market Record screen

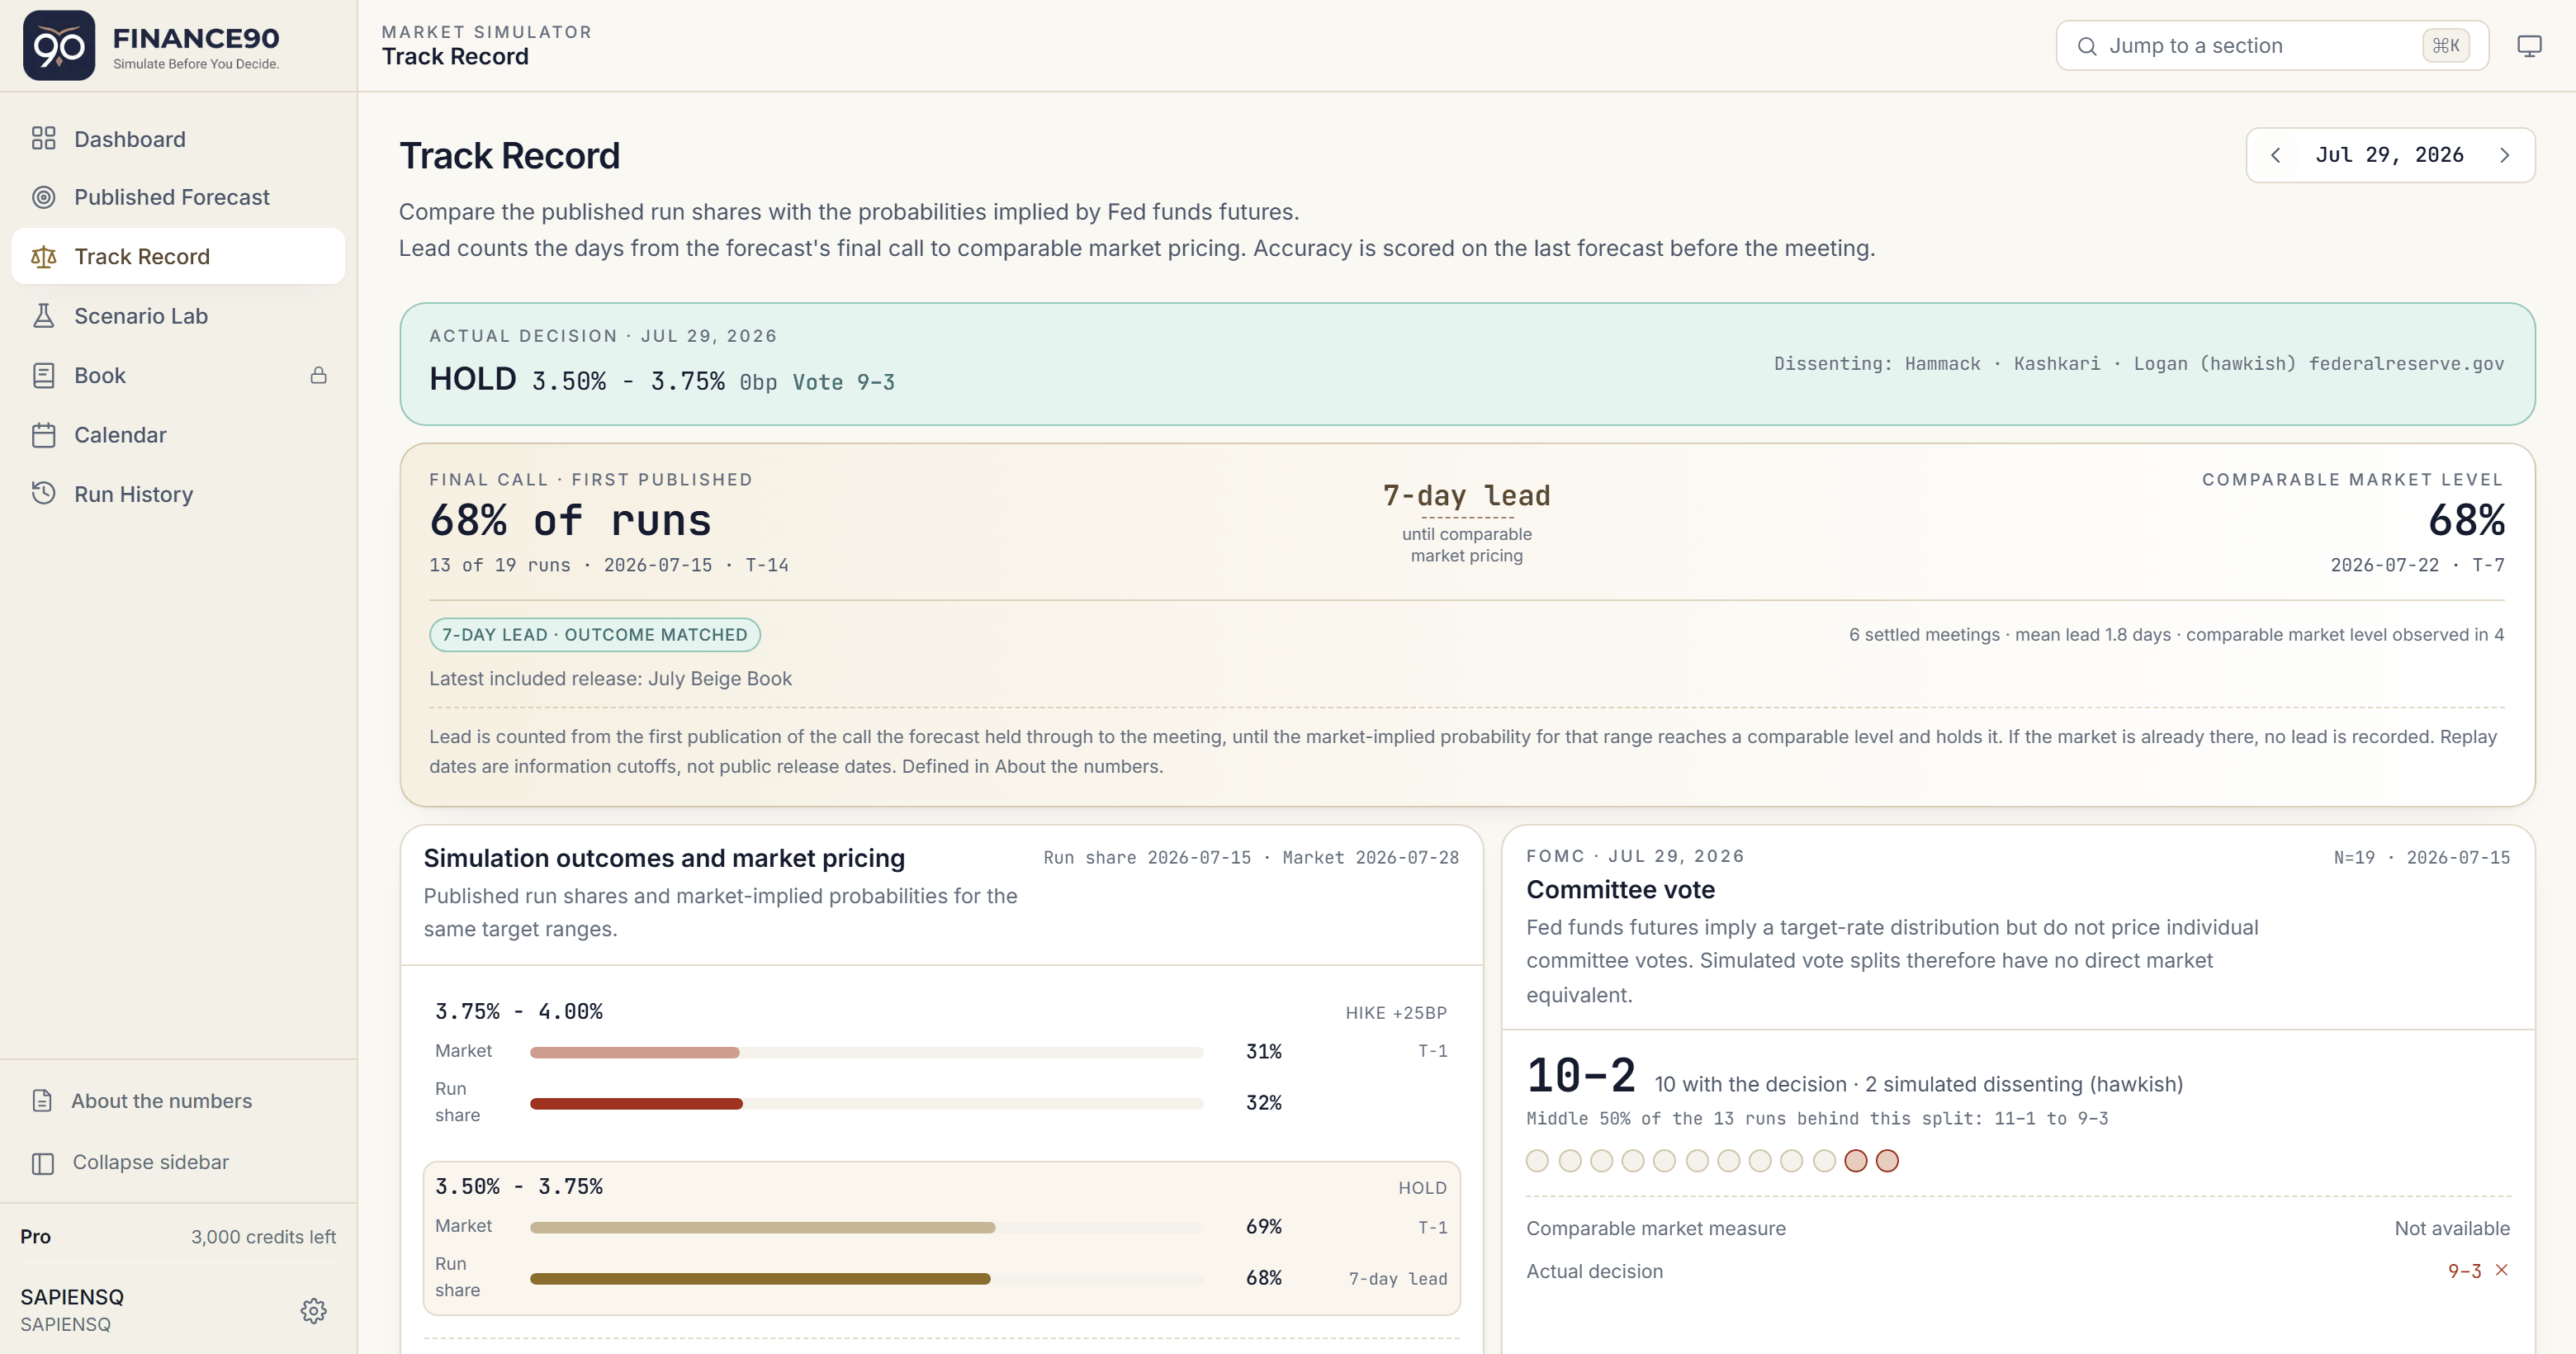
Forecast & Market Record

The published forecast, the market-implied view, and the record once the decision is known.

  • The published forecast beside Fed funds futures for each meeting.
  • Scores appear only after the decision is released.
  • Lead time: how early the published call preceded the same market-implied outcome.
The Scenario Lab screen

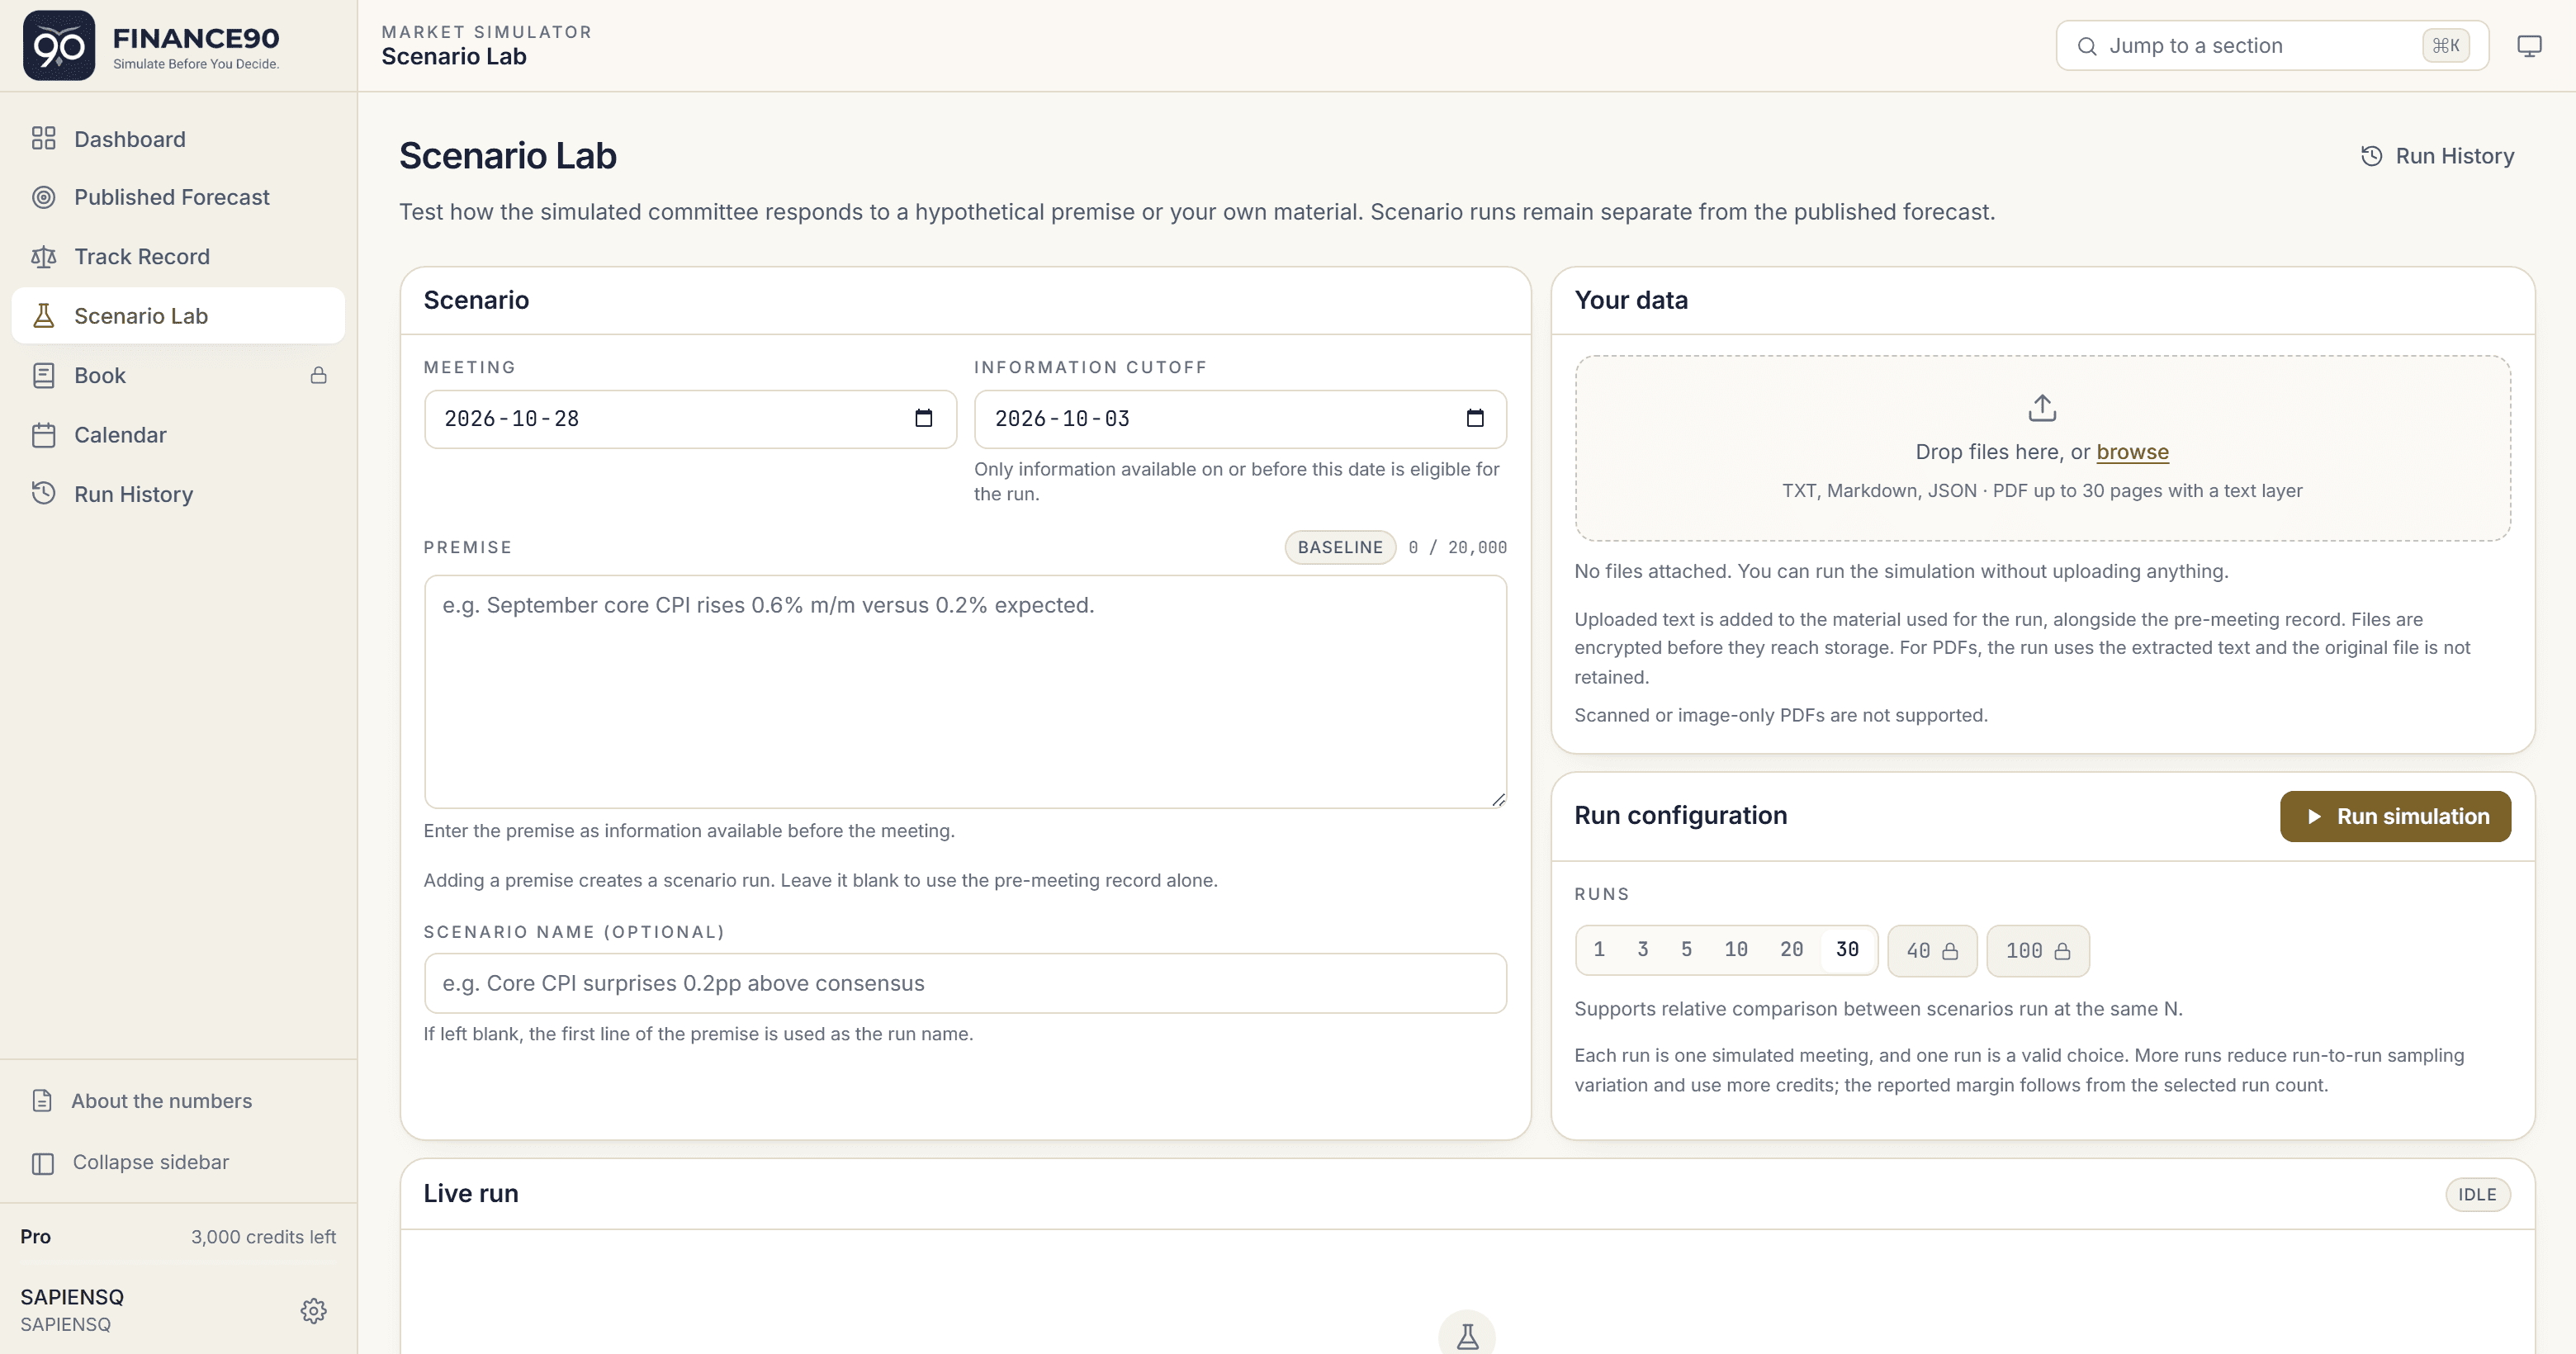
Scenario Lab

Test how the committee responds to a hypothetical scenario or your own material.

  • Write a scenario, attach your own material, and simulate the committee’s response.
  • Choose N and see the corresponding confidence interval before you run.
  • Scenario Lab runs never alter the published forecast.
The Calendar screen

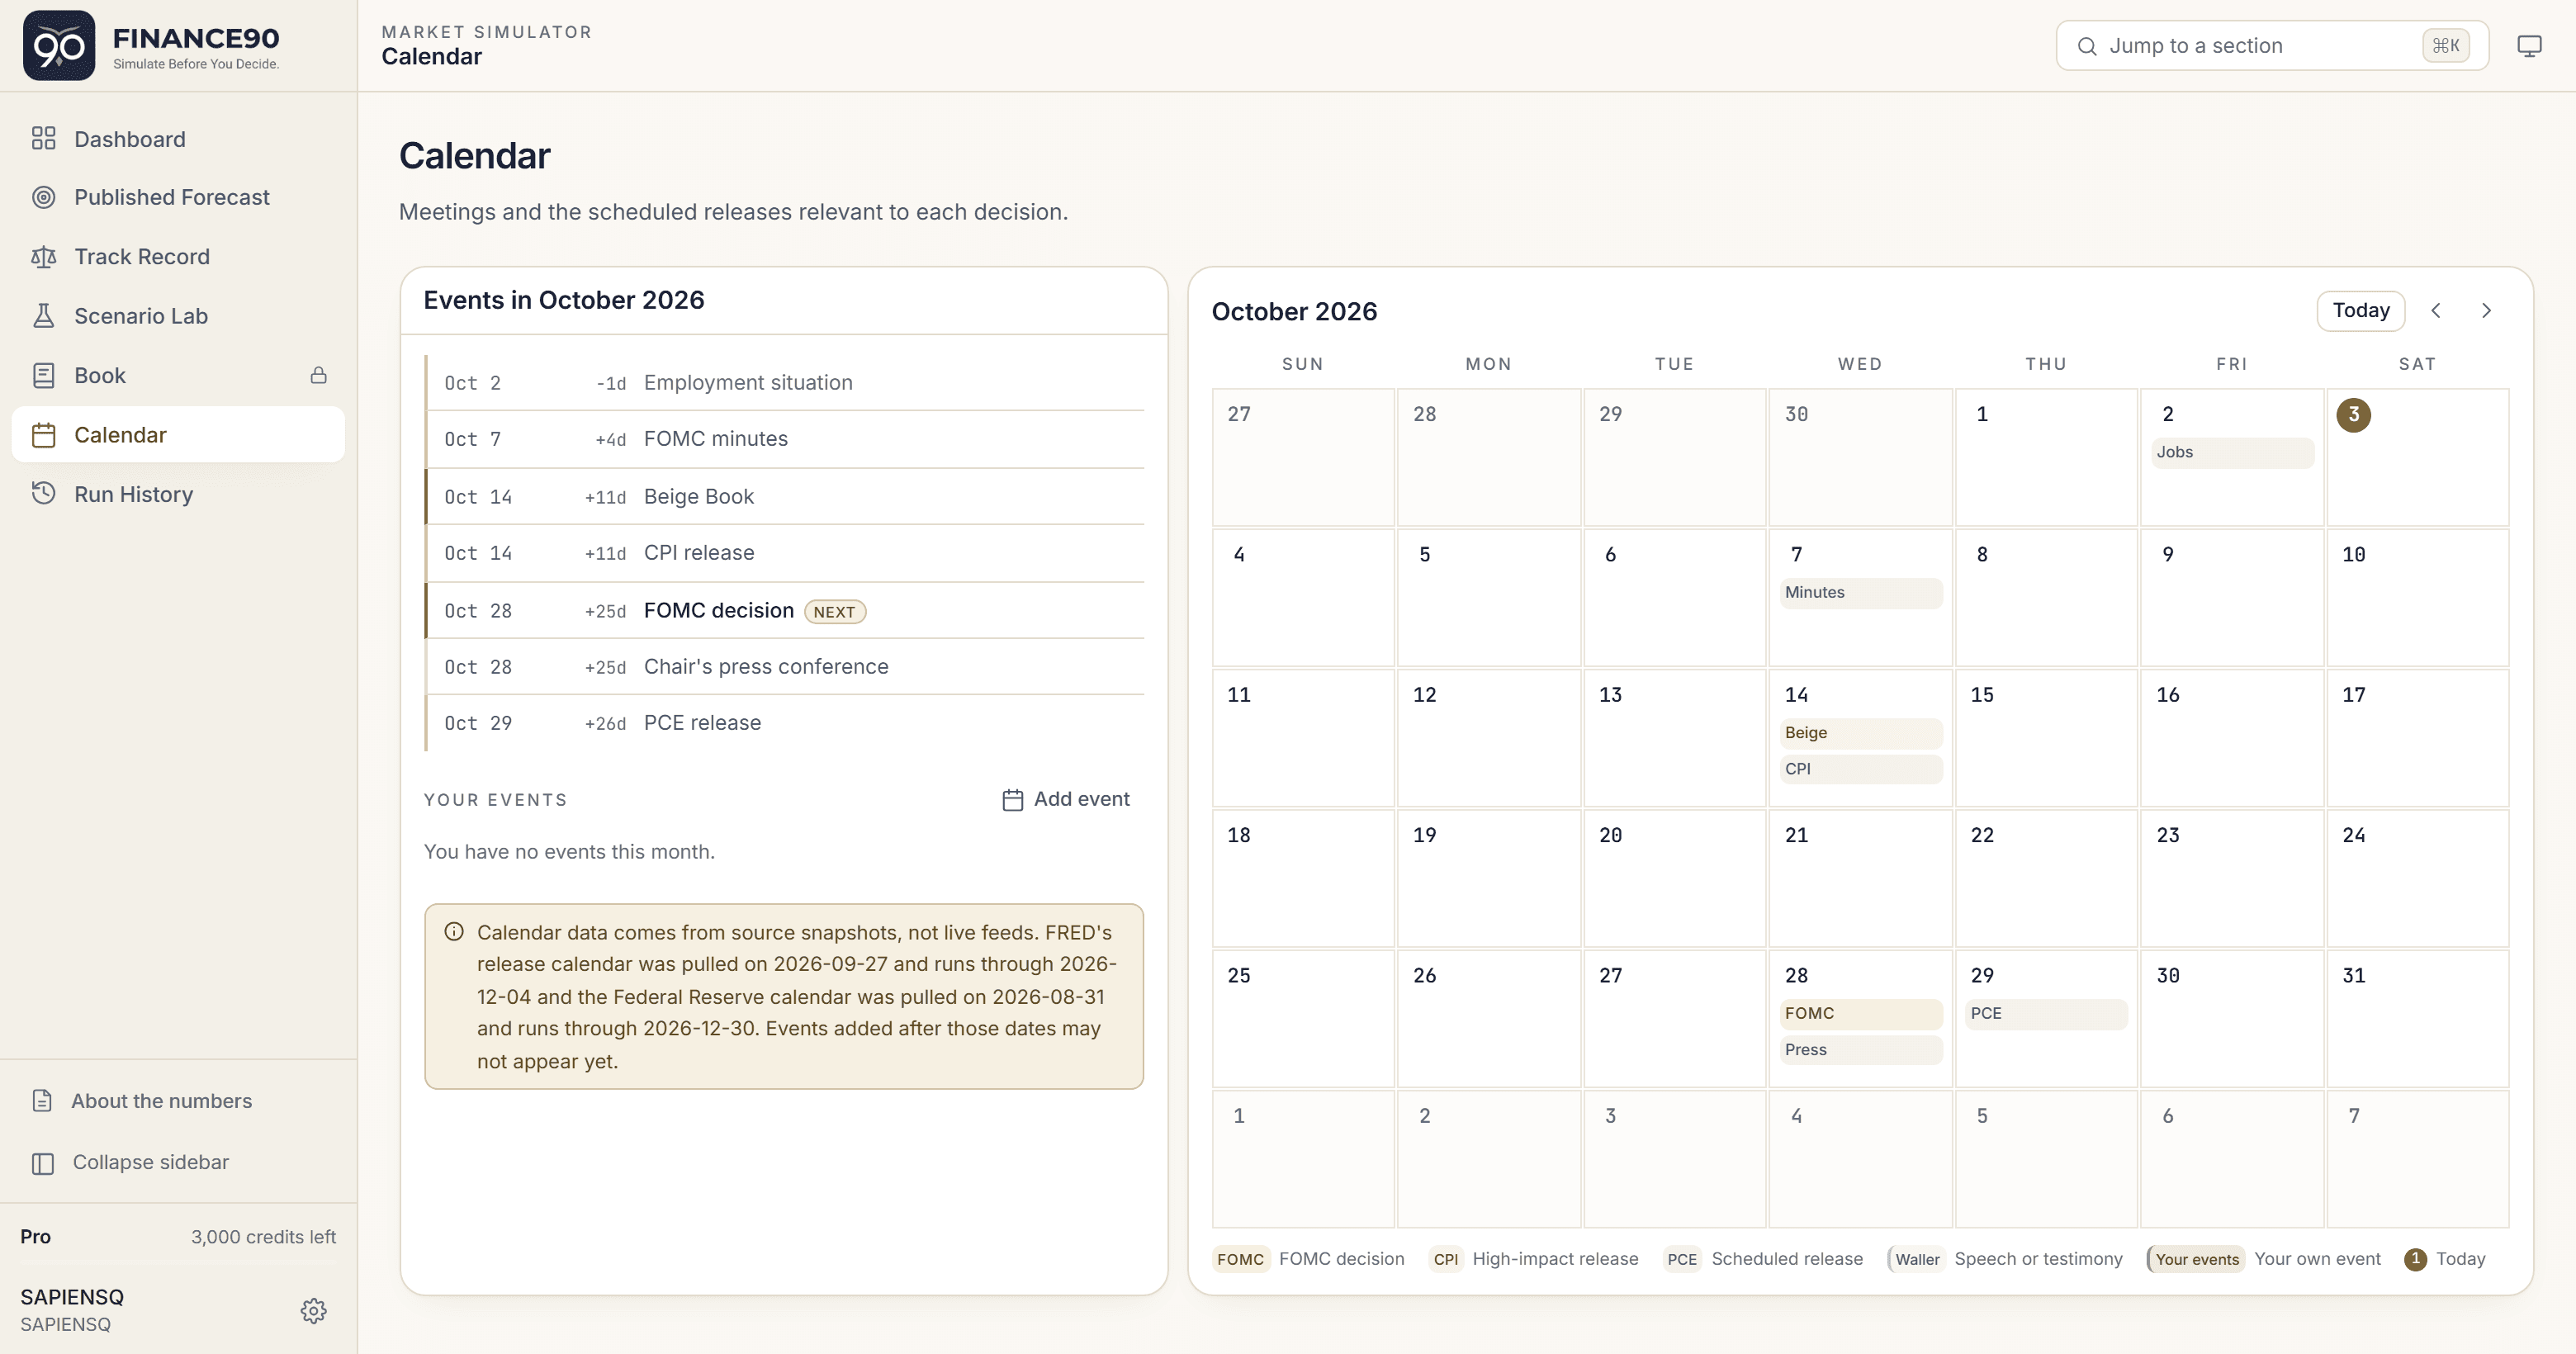
Calendar

Meetings and scheduled releases, month by month.

  • Every scheduled release between today and the next decision.
  • Import any Google Calendar on your account, including secondary calendars.
  • View your own events alongside scheduled releases in a single calendar.
The Run History screen

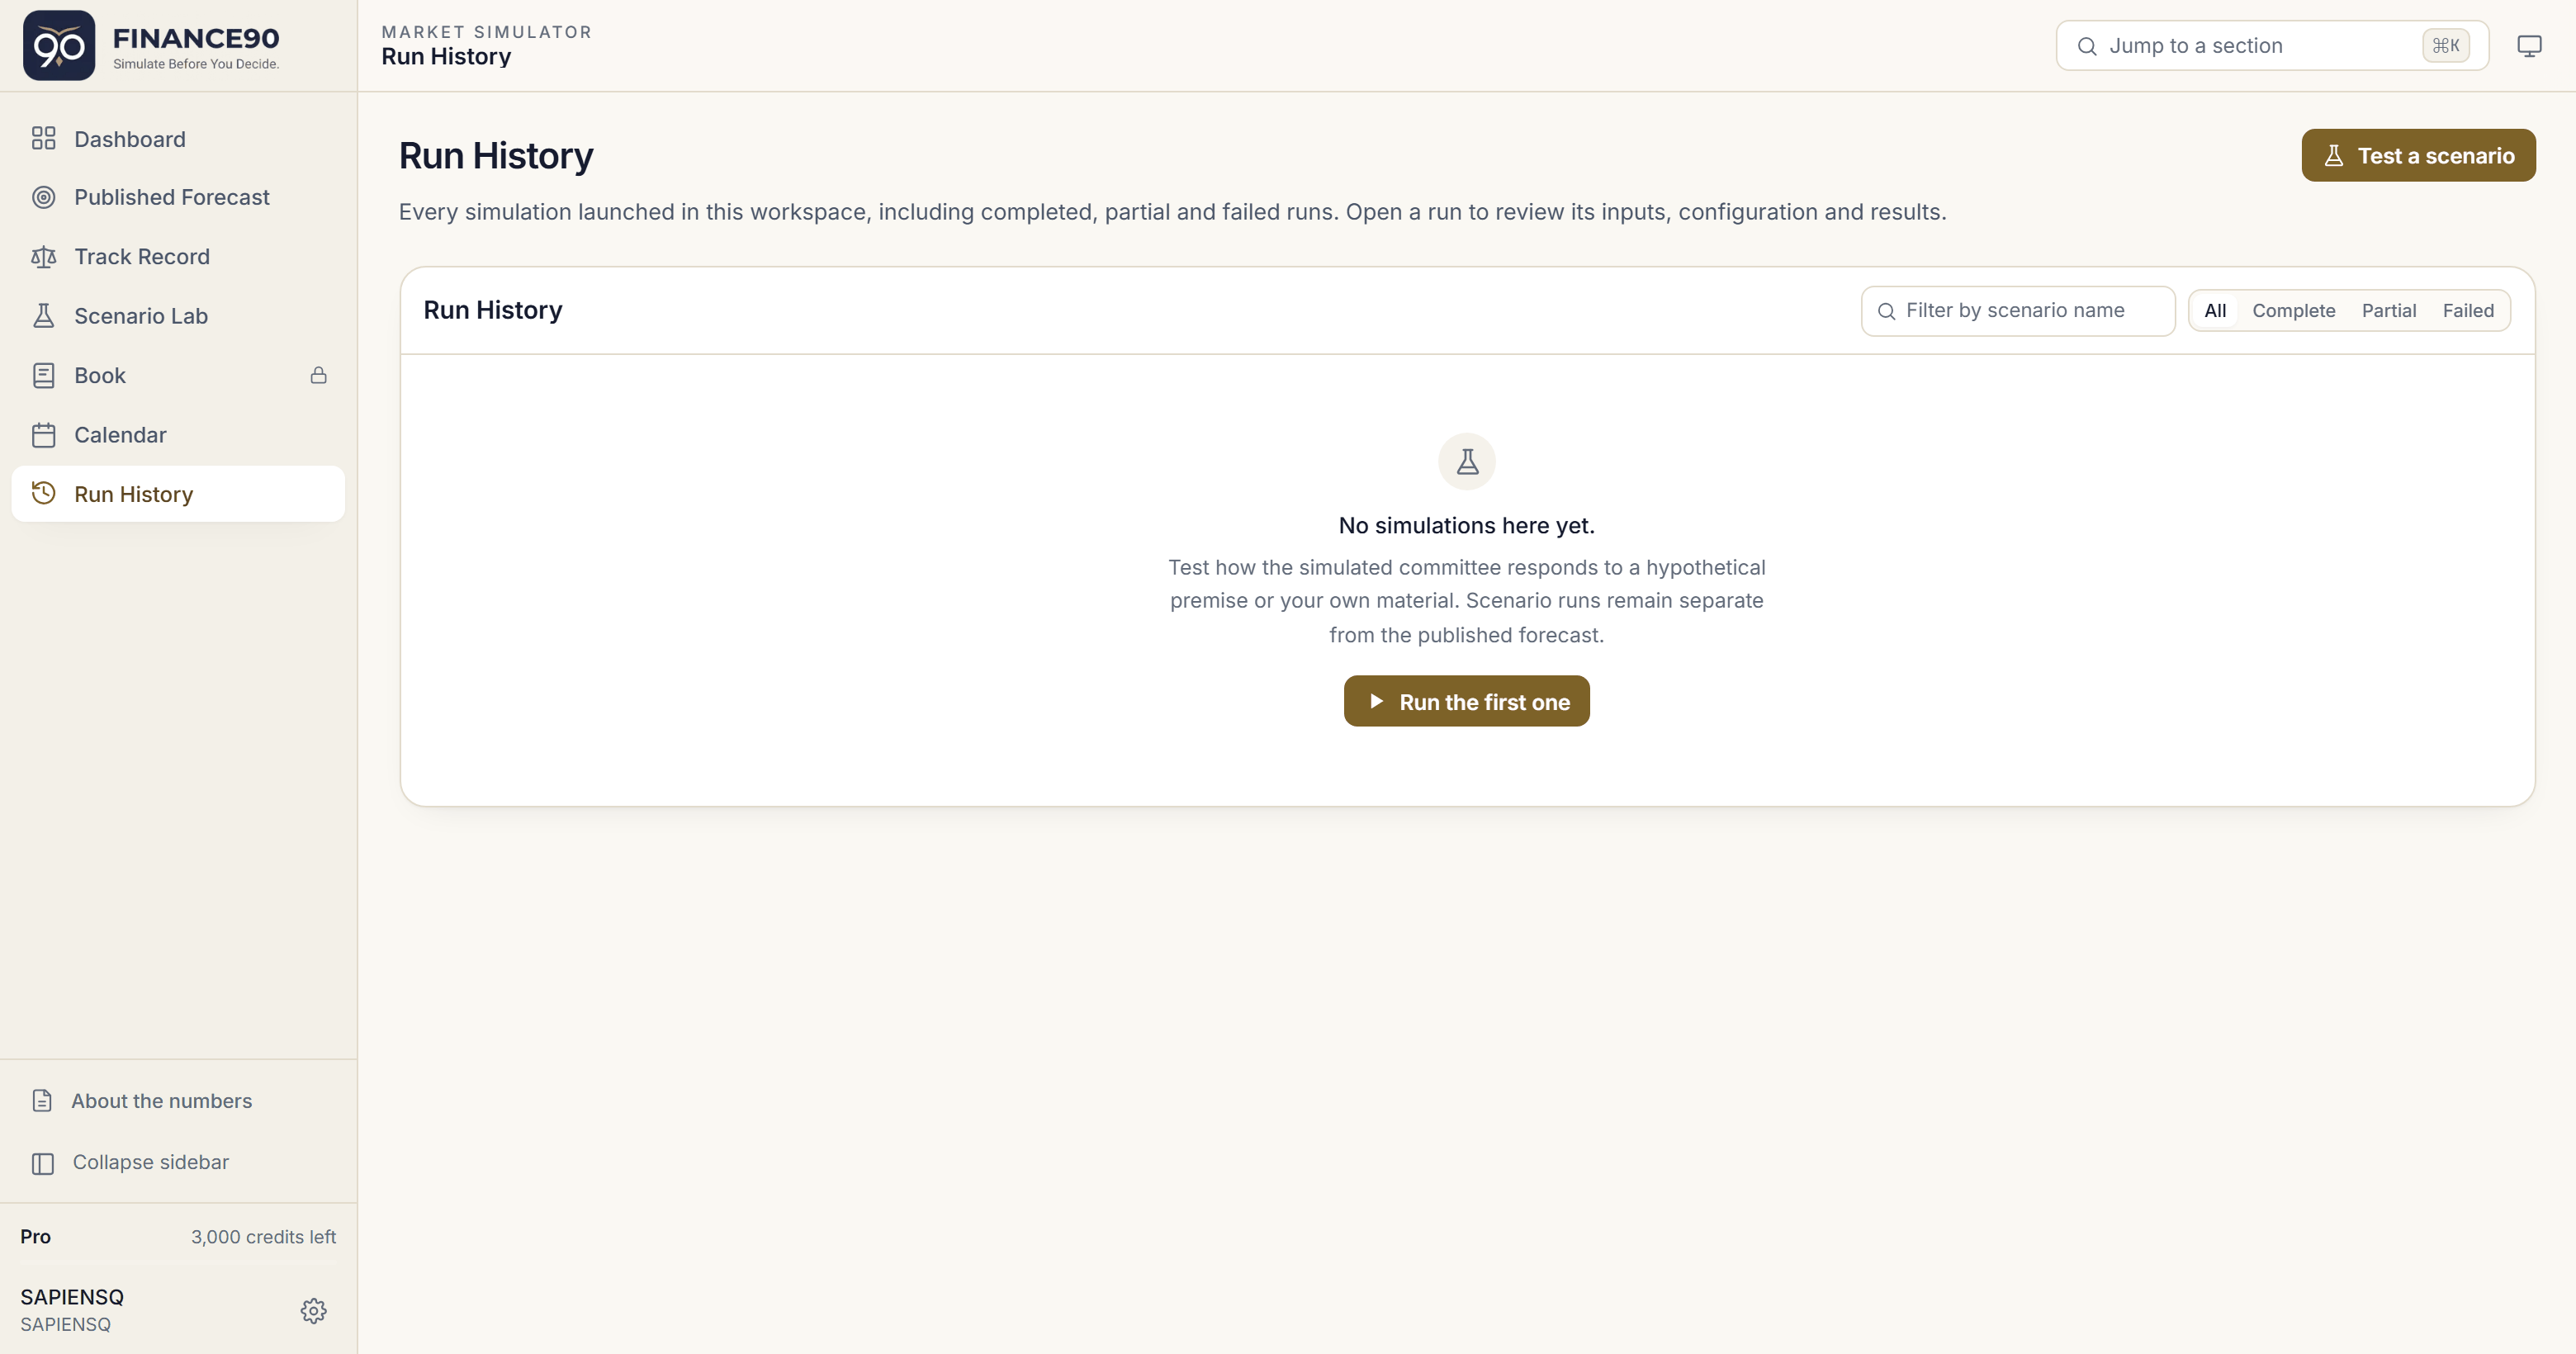
Run History

Every simulation run in the workspace, with its inputs, configuration and results.

  • Every run this workspace launched, with its inputs and configuration.
  • Every report includes N and its confidence interval.
  • Each report has a stable permalink for persistent citation.

The workspace also includes the dashboard, the published forecast behind the track record, and the methodology used for every reported figure.

Access

Plans and credits

Each plan sets a monthly credit allowance and a maximum N per experiment. Higher N produces a tighter estimate for the same scenario.

Free

Start without a credit card.

Free access includes the published forecast, Market Record, Calendar and methodology. Scenario Lab stays visible, but runs require credits.

First purchase: 500 credits for $9.90, enough for 5 runs. Available once per account and valid for 14 days.

Request access

Subscriptions

Academic

$99/month

  • 2,000 credits per month
  • Equivalent to 20 N = 1 runs
  • Up to N = 20 per experiment
  • 1 seat
  • Shared infrastructure with row-level data isolation
Request access

Institution

Pricing on request

  • 140,000 credits per month
  • Equivalent to 1,400 N = 1 runs
  • Up to N = 100 per experiment
  • Unlimited seats
  • Dedicated database
Contact us